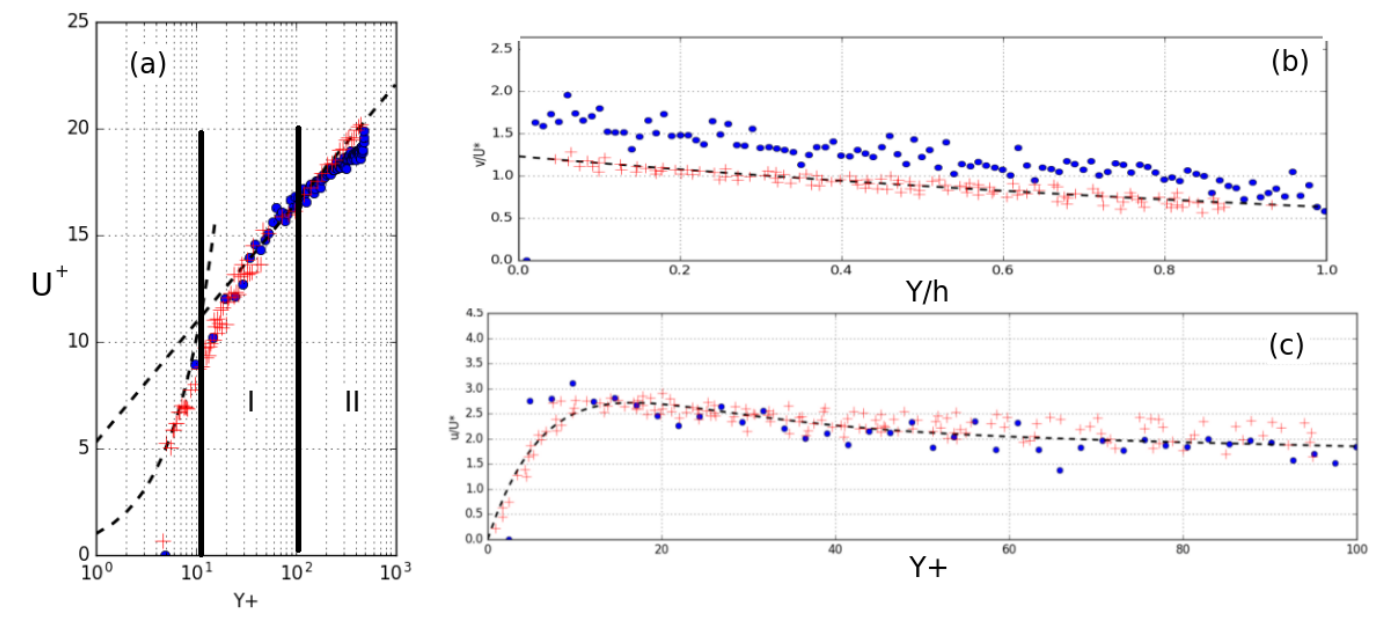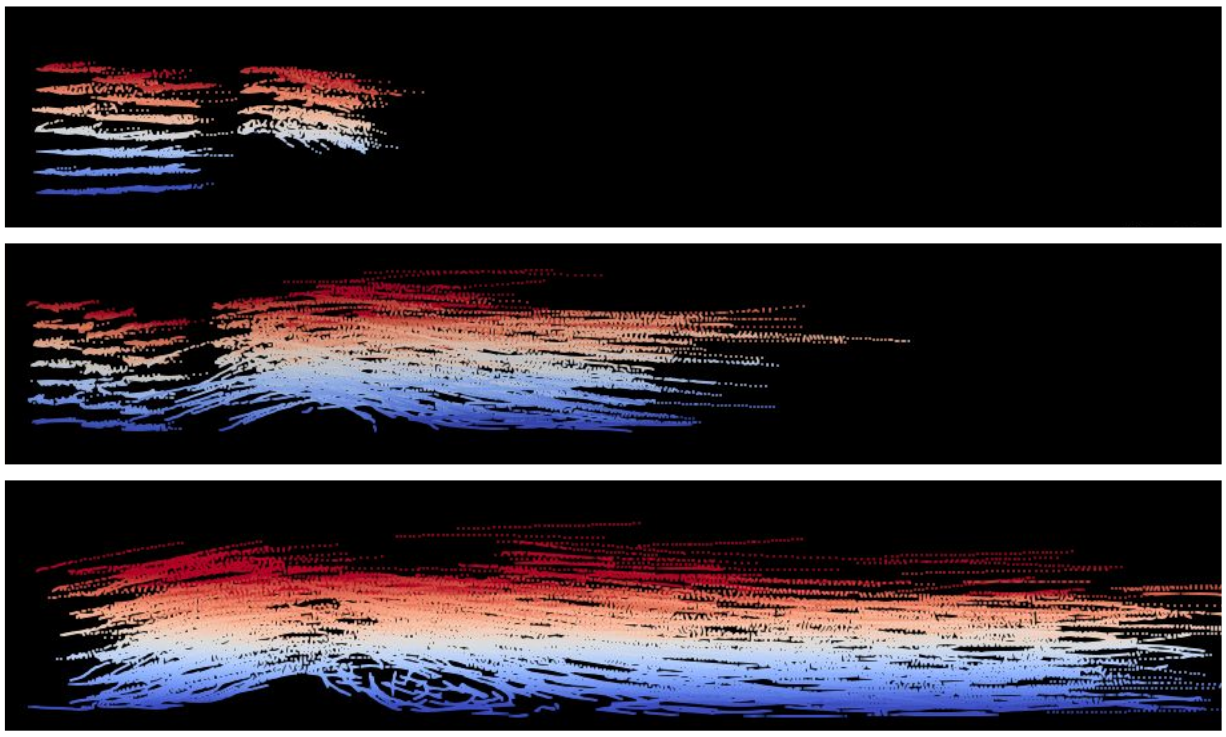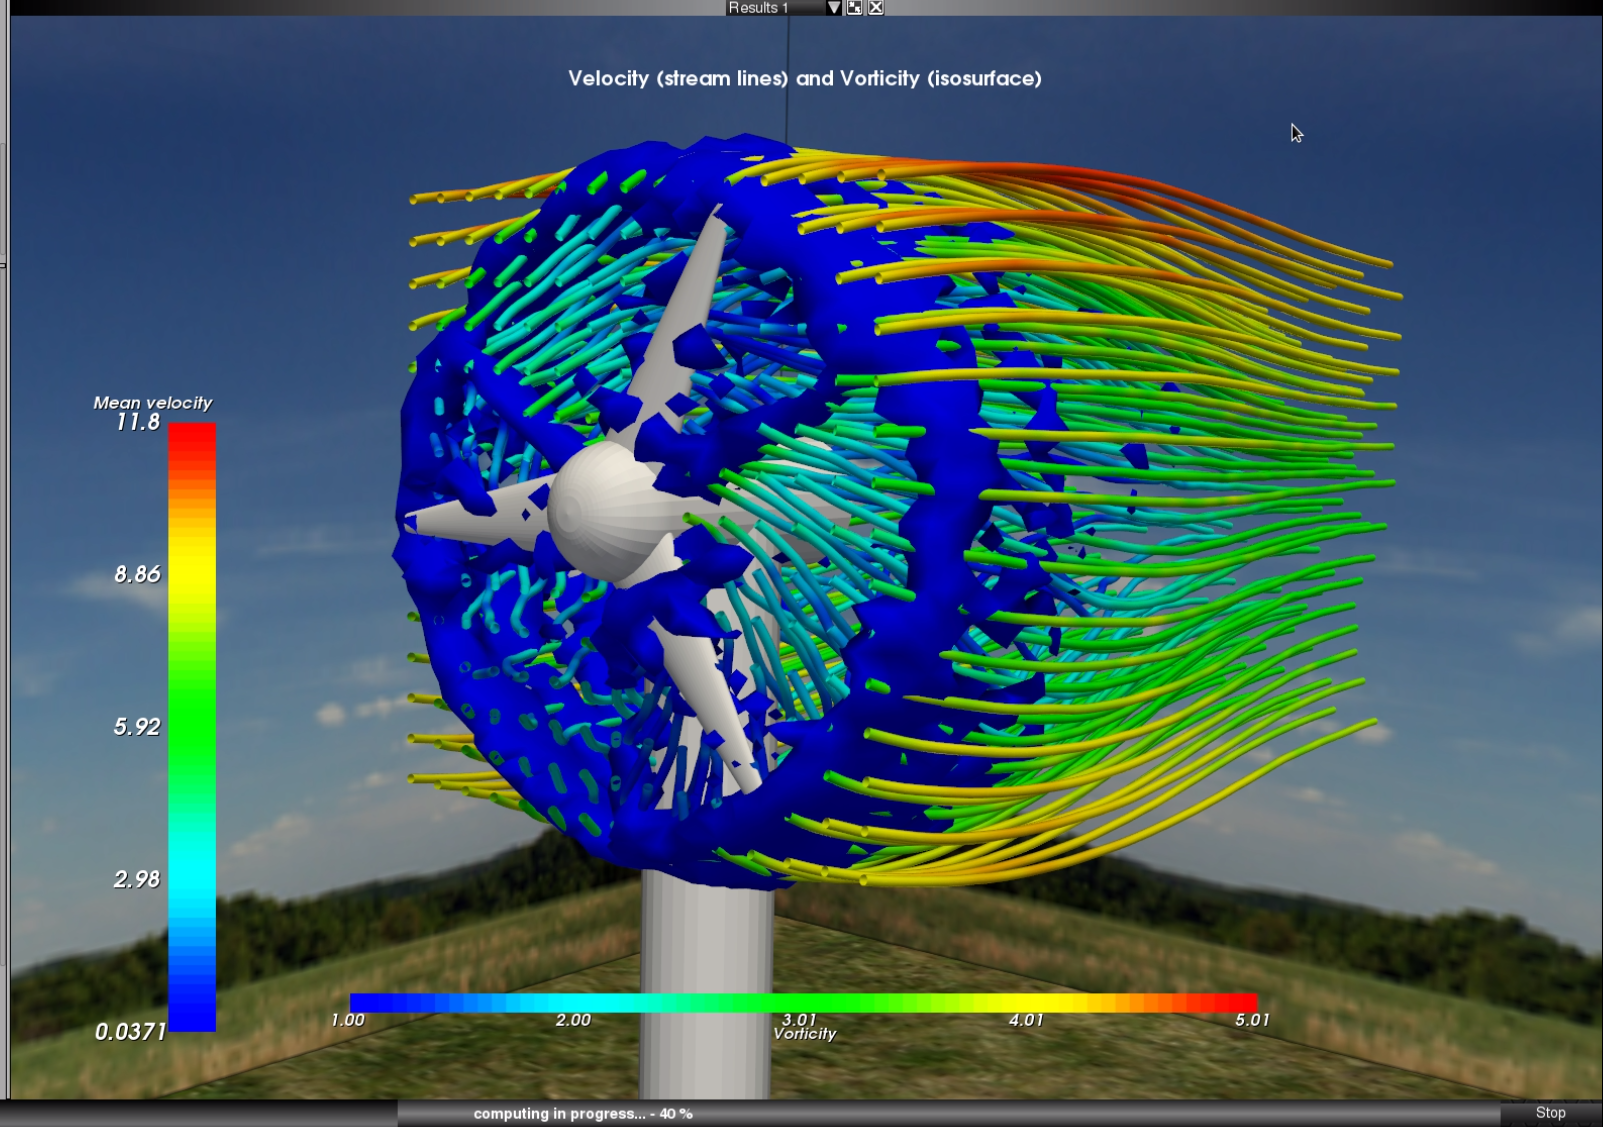
Comparisons between numerical predictions (•), theoretical predictions (–) and measured (++) mean velocities (a), averaged horizontal (b) and vertical (c) fluctuations velocities. (click image for animation)
I- GENERATION OF THE BOUNDARY LAYERS:
Assess the ability of SDM to reproduce the basic physics of a turbulent flow without turbine.
Numerical tests have been made using the parametrisation of the turbulent viscosity proposed in the study from Nezu and Rodi (1986) derived from laboratory measurements (Y+ = yU ∗ /ν, U+ = U/U ∗ , with U ∗ = 0.44 cm/s, and h = 10 cm.)
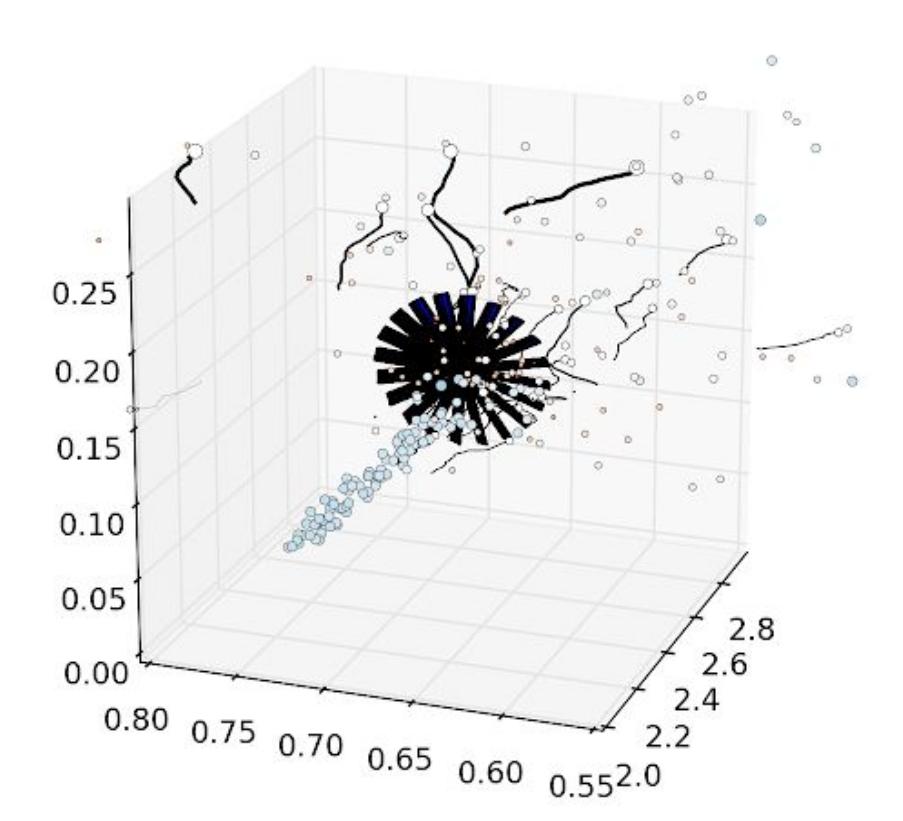
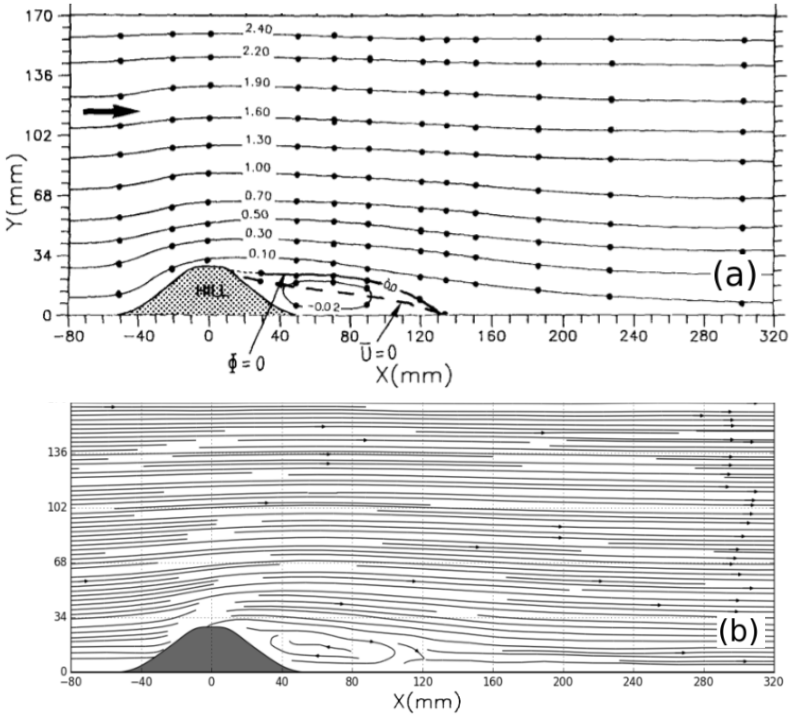
Streamlines estimated from experimental measurements (Almeida et al., 1993) and calculated by SDM–OceaPoS (b) (click image for animation)
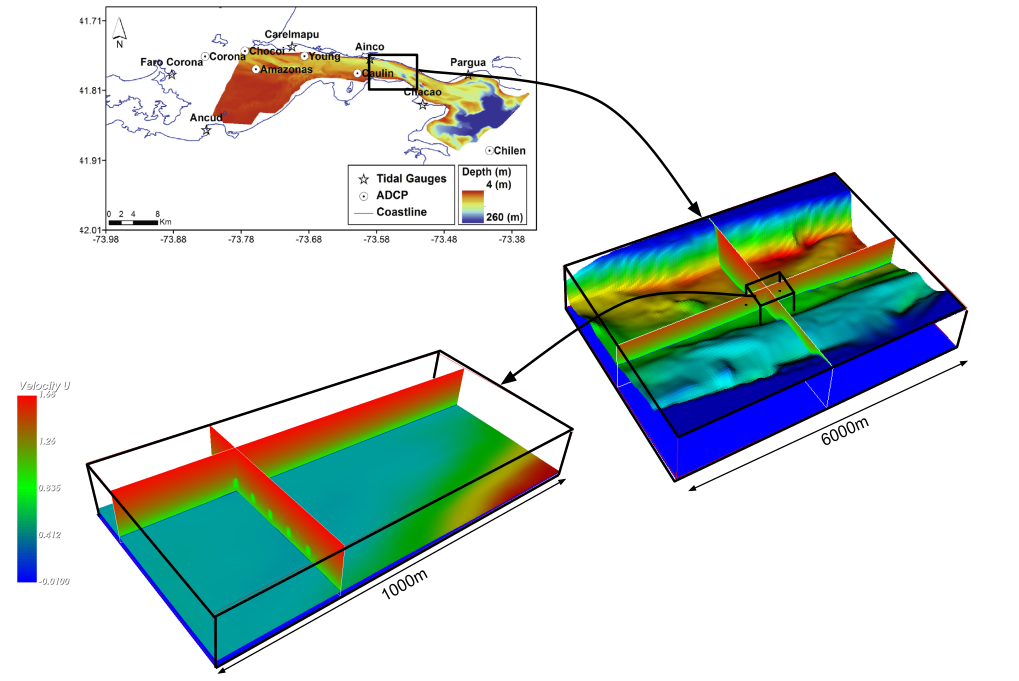
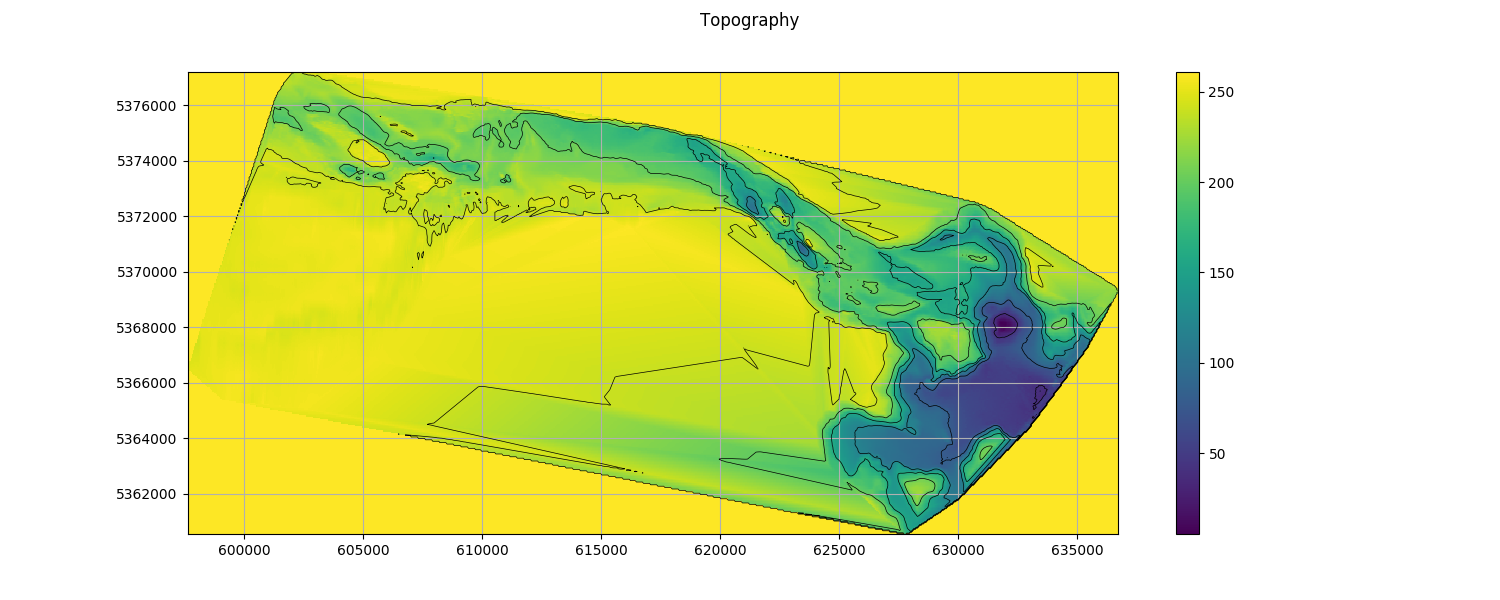
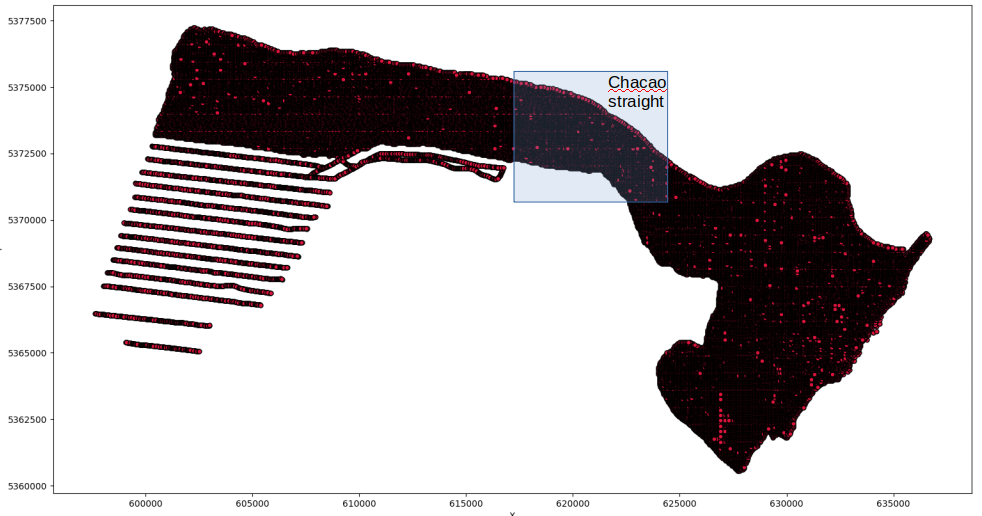
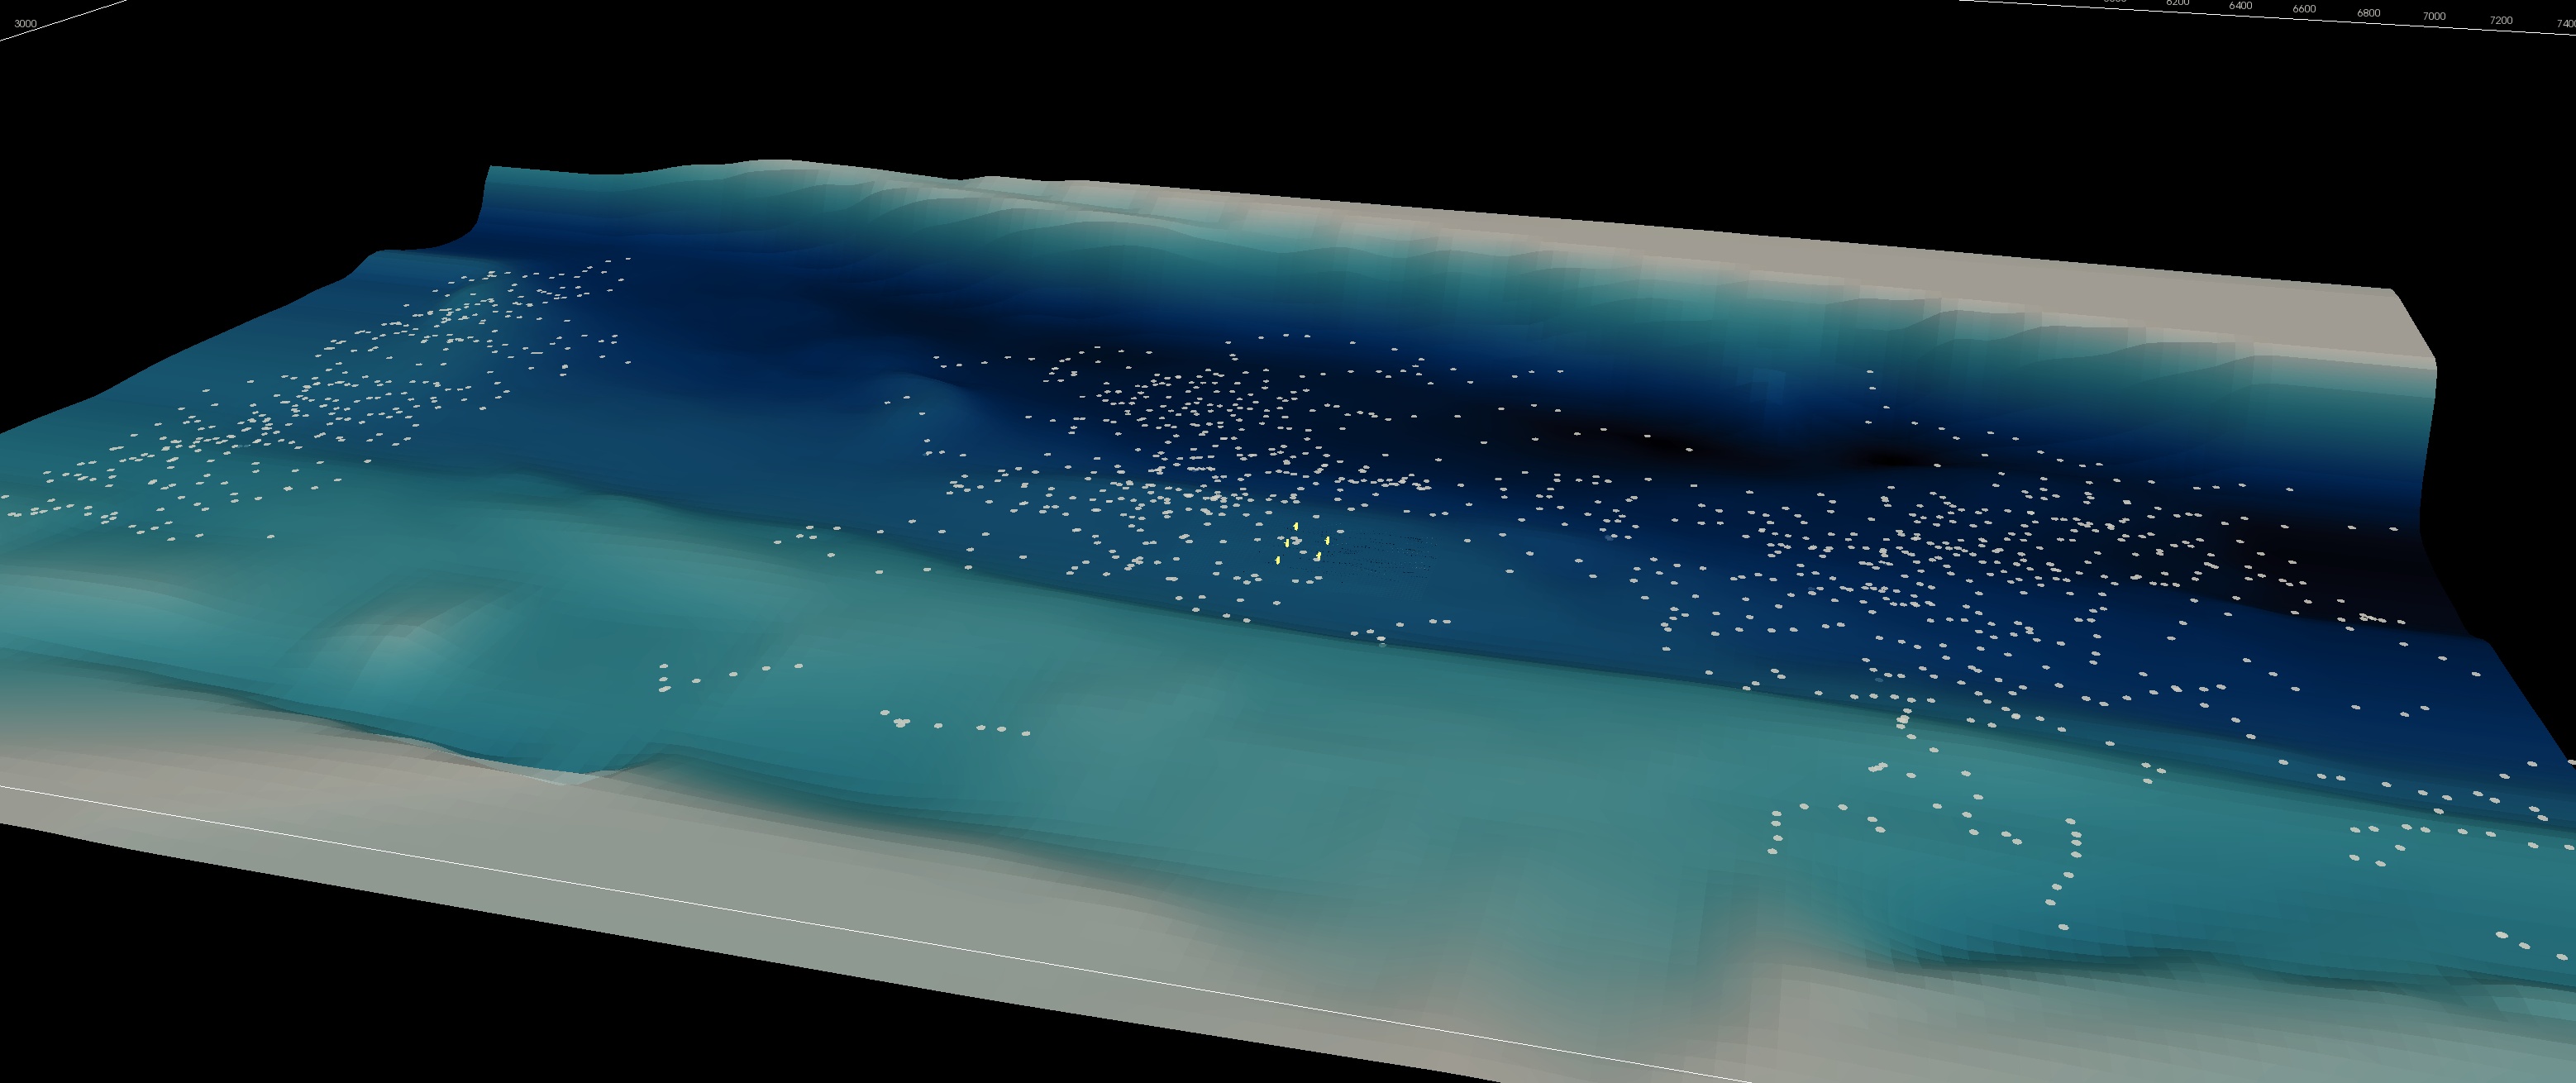
II-INFLUENCE OF BATHYMETRY ON THE FLOWS
Consider a known 2D hill shaped bathymetry placed in a water tunnel to measure its effects on turbulent flow. All numerical results have been compared to experimental measurements performed by Almeida et al. (1993).
It can be observed that the recirculation zone is well described by the code and that its dimensions are very close to those observed experimentally. This experimental cases are used to validate the particle reflection method.
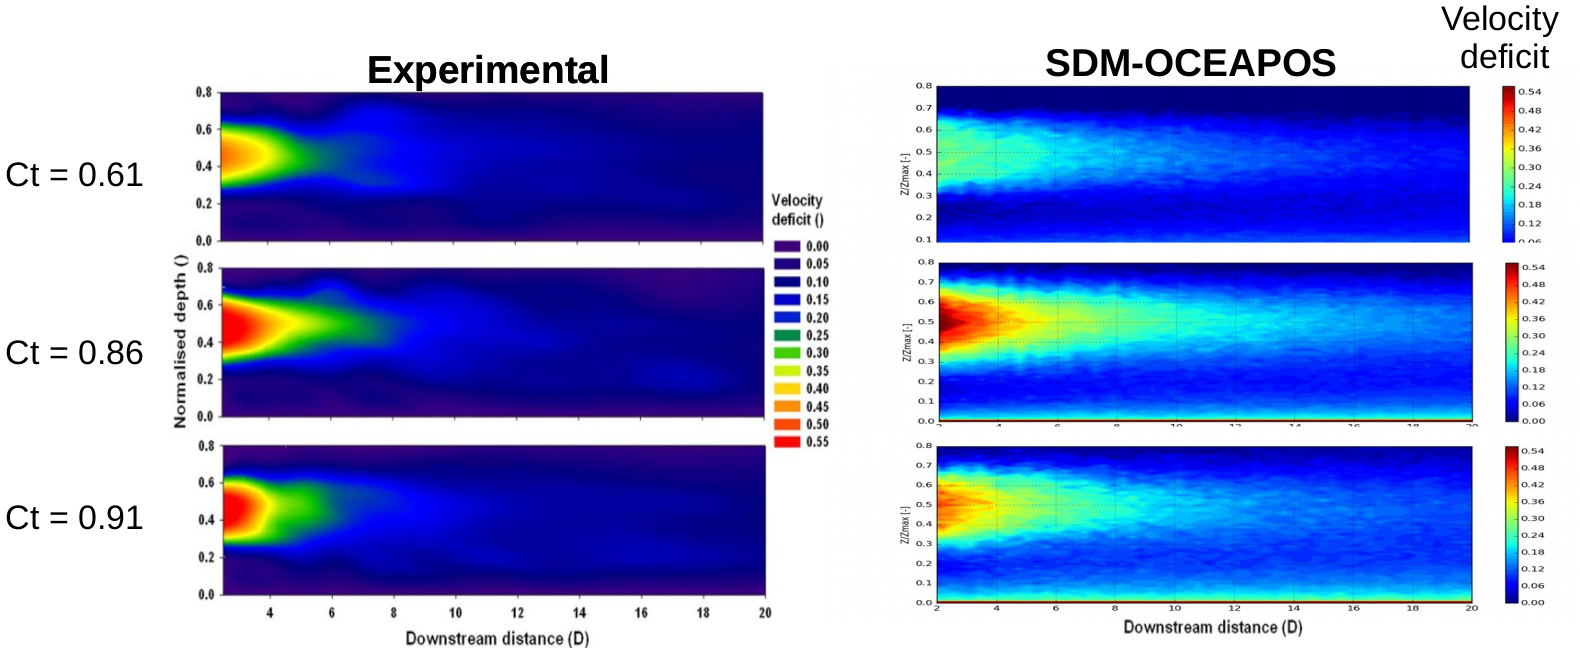
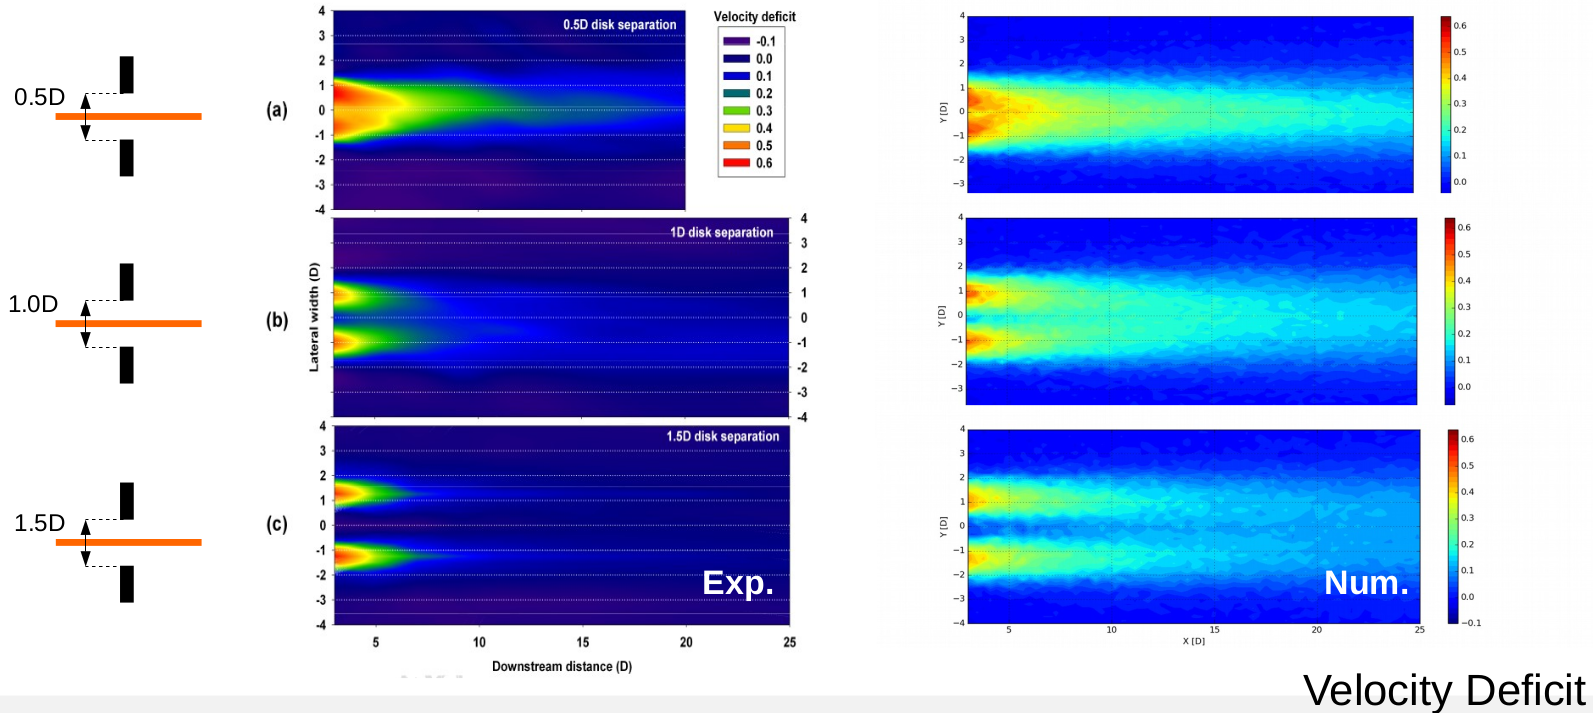
Comparison of speed deficits of different disc porosities measured in a channel (Myers and Bahaj, 2010) (left) and predicted by SDM–OceaPoS (right). (click image for animation)
III- 5. CASES INVOLVING NON-ROTATIVE TURBINE(S)
The ability of SDM–OceaPos to describe both the velocity deficit and the turbulent intensity generated by one or various porous disc(s) introduced in a turbulent 2D flow is compared against experiments from Myers and Bahaj (2010, 2012).
Comparison of speed deficits of different disc porosities measured in a channel (Myers and Bahaj, 2010) (left) and predicted by SDM–OceaPoS (right), for two discs. (click image for animation)
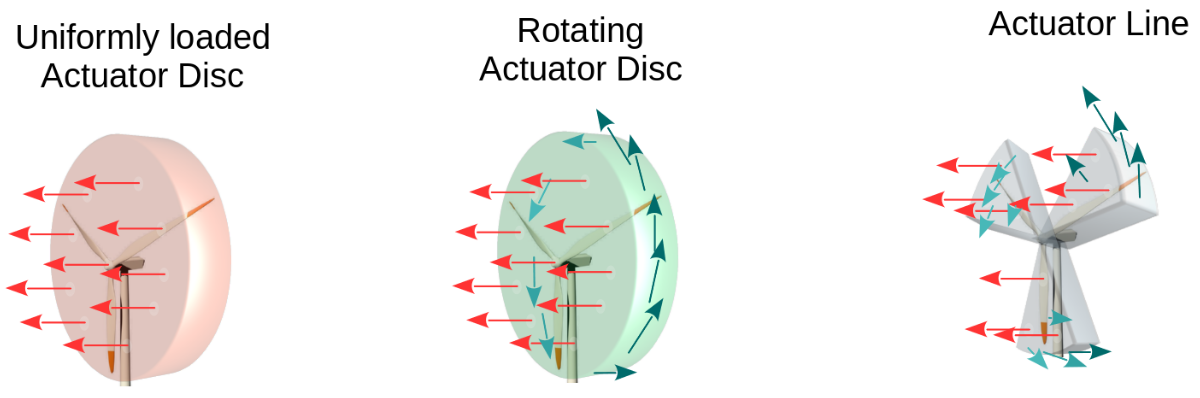
A new turbine model has been implemented based on the porous actuator disc theory which represent the efect of the Hidro-Kinetic Turbines in the flow. These are introduced in a 21 m x 1.35 x0.3 m at differrent heights. The mean velocity of the flow equals 0.25 m/s and Re = 75, 000.
This model can reproduce with quantitative concordance all the features measured for channel flows with actuator discs used in the experiments.