


Motivation
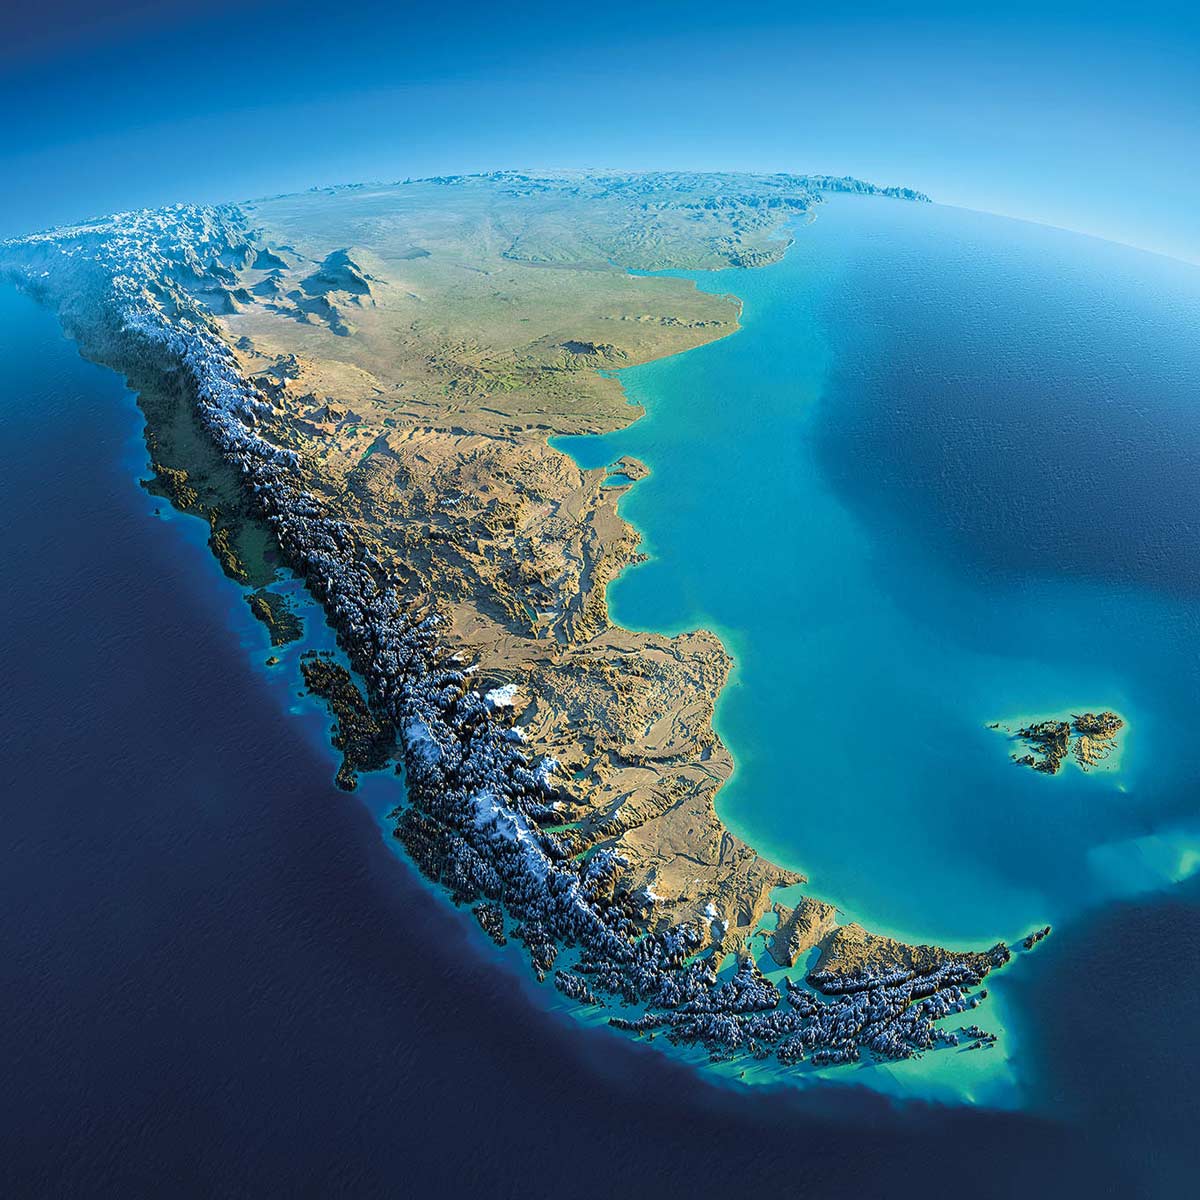
The Chacao Channel in the south coast of Chile has been identified as a site of great interest for a tidal energy project:
“a pilot project of 2.4MW can produce 11.2 GWh per year, injecting in a 23 kV line. The region can integrate 7.4MW without significant impact […] on the transmission system “. (sources: Villalón, Watts, Cienfuegos in Renewable Energy 2019 and Guerra, Cienfuegos, Thomson, Suarez in International Journal of Marine Energy 2017).
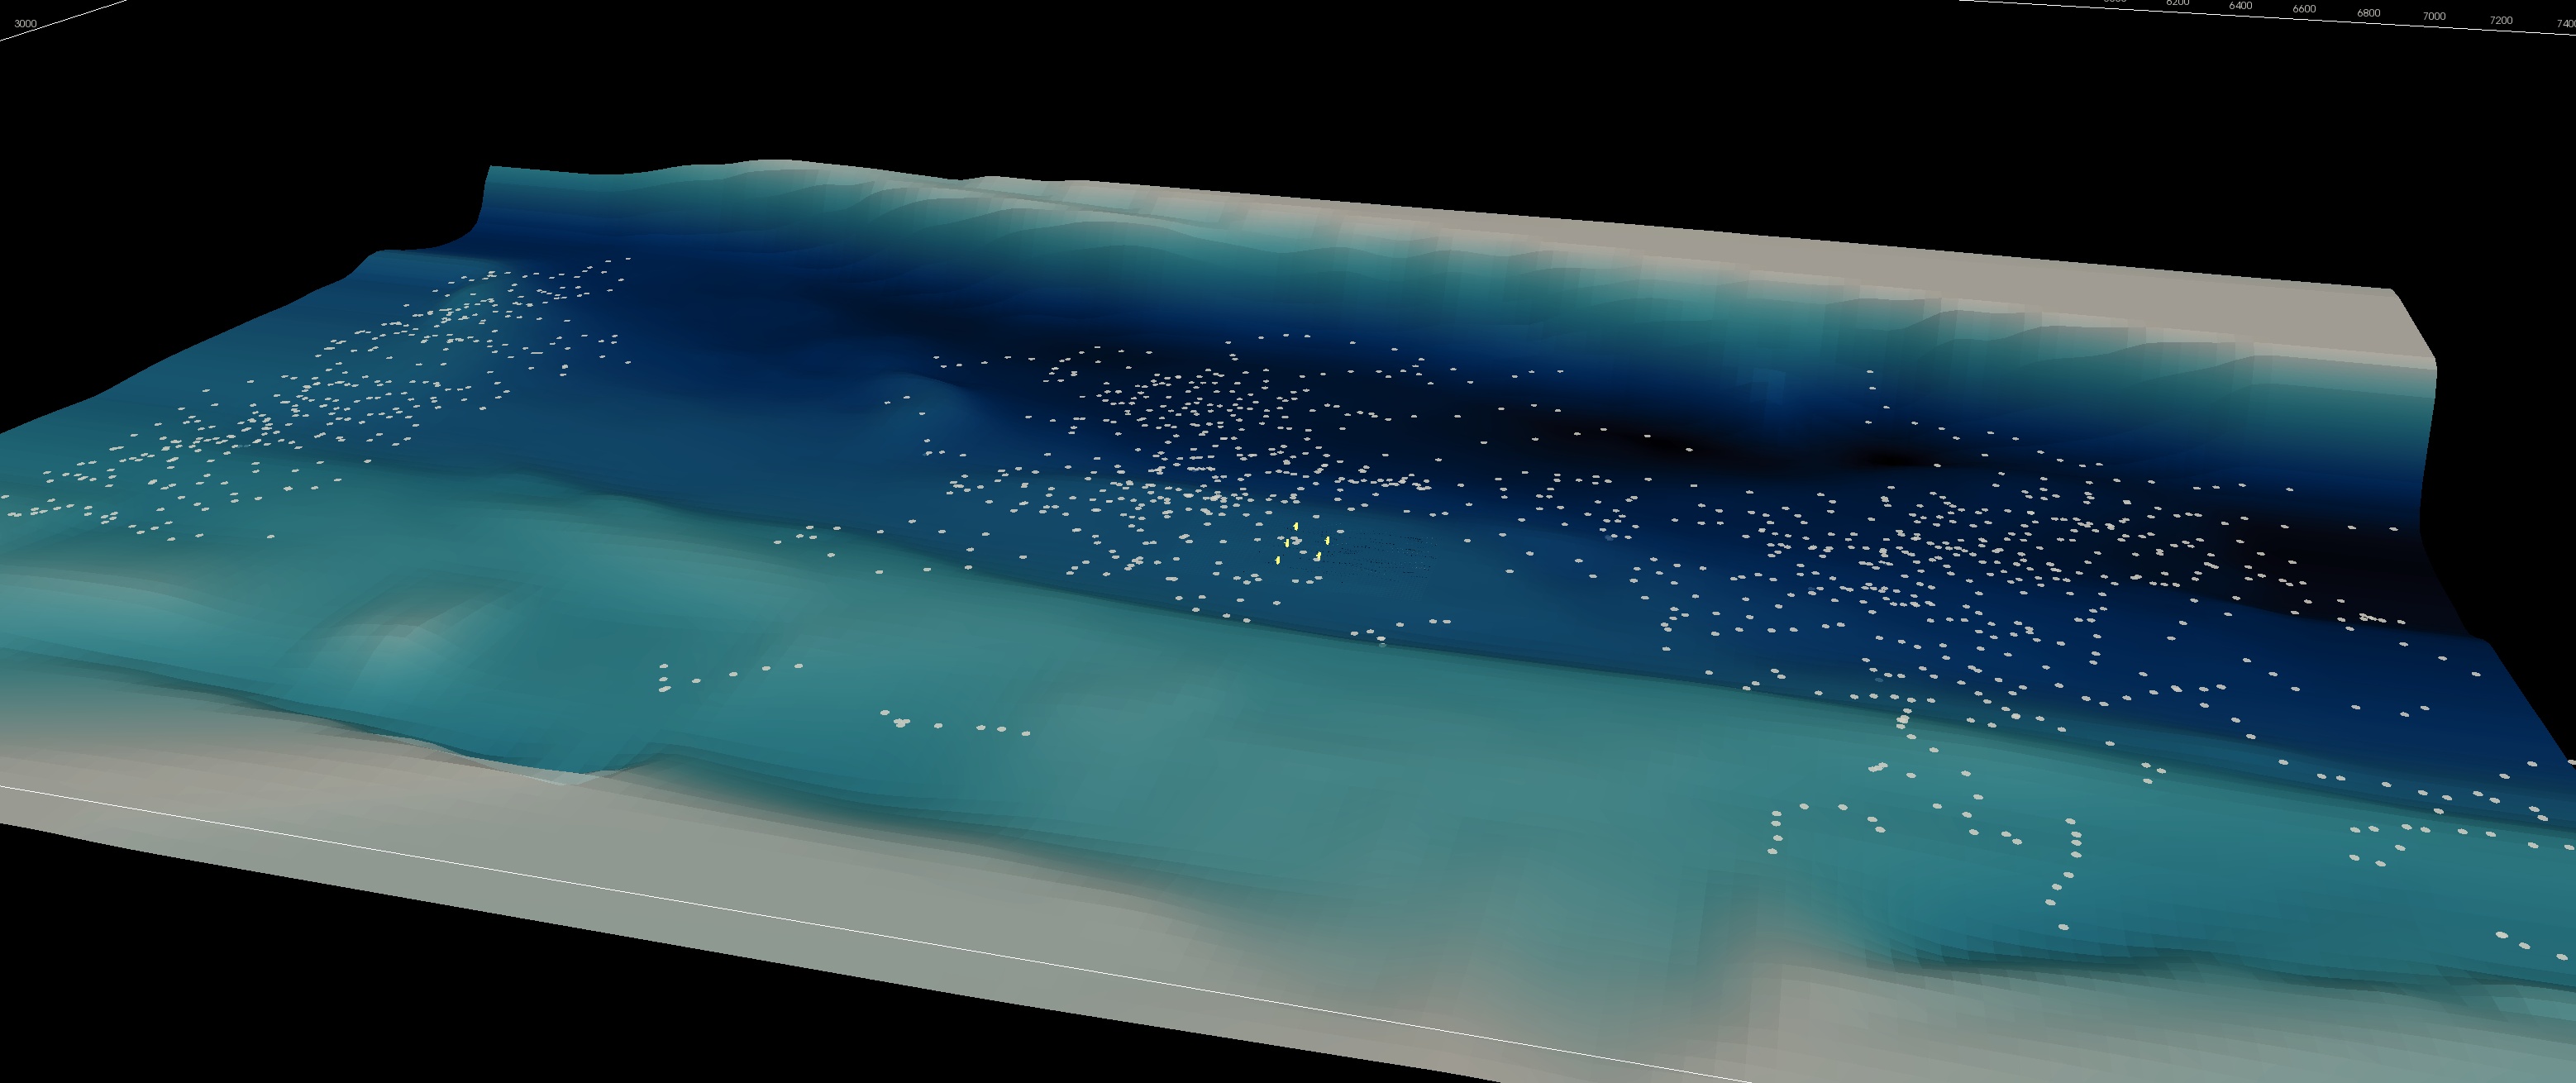
The objective of this simulation was to analyze the reach of performing a full-scaled Chacao channel bathymetry underwater conditions in complete 12-hour tidal range cycle ( from high-tide condition to low-tide condition and back) and observe the switch int the flow direction.
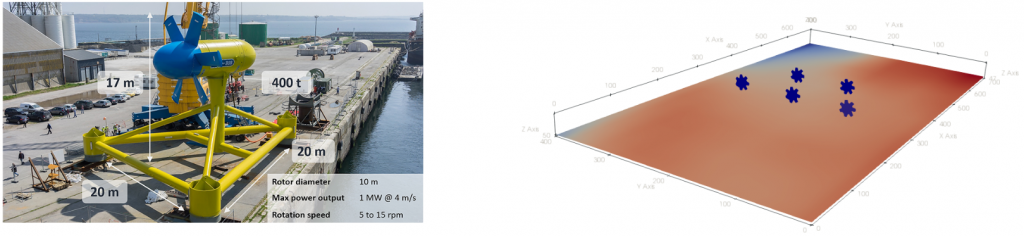
Measurment locations of the complete Chacao Channel bathymetry; and selected section for the simulation.
Bathymetry considerations
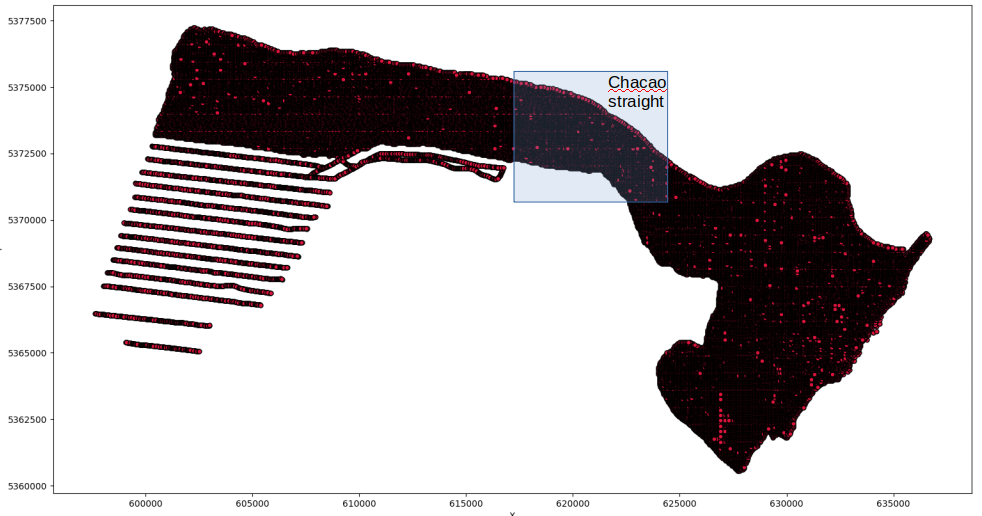
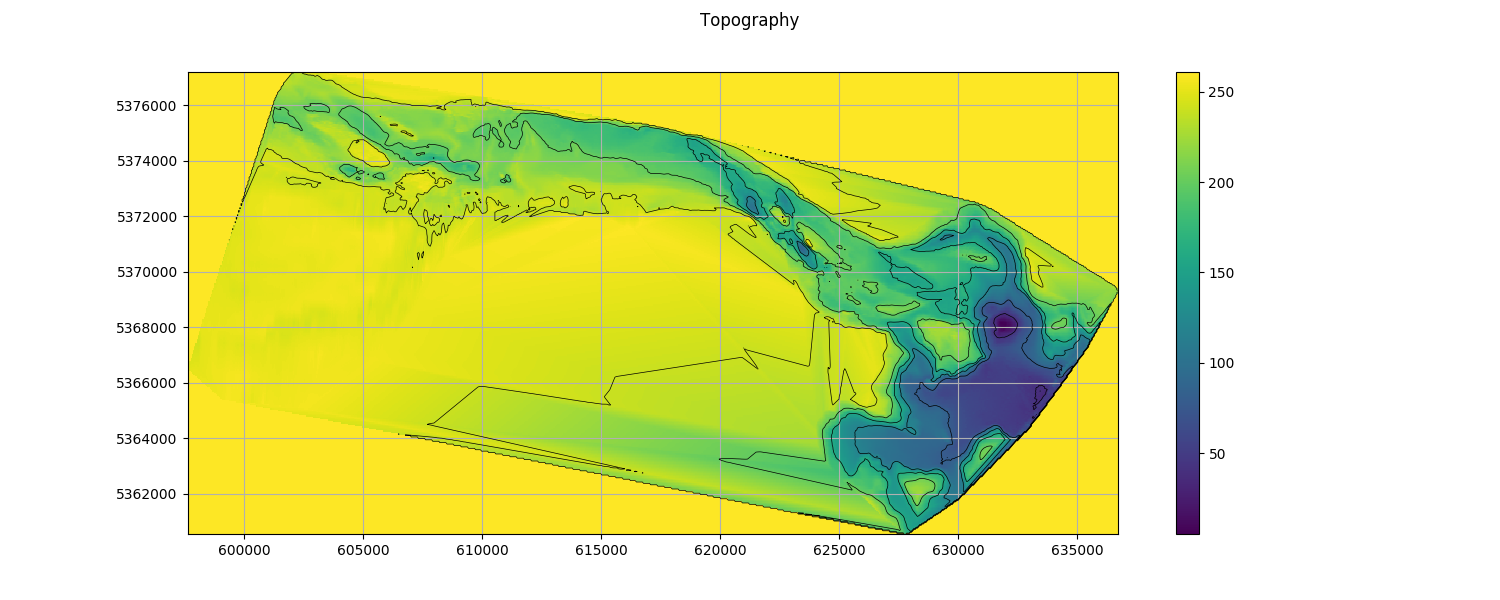
Thanks to the colaboration of the Hidraulic and Ambiental Department of the Universidad Catolica, we were able to acces a detailed bathymetry (50m x50m) grid of the complete Chacao channel with a total extension of 636700m x 5377250m and maximum depth of 261m. Only the narrowest section of the channel was considered for the analysis, defining a domain of 56900m x 4300m extention and 103m depth.
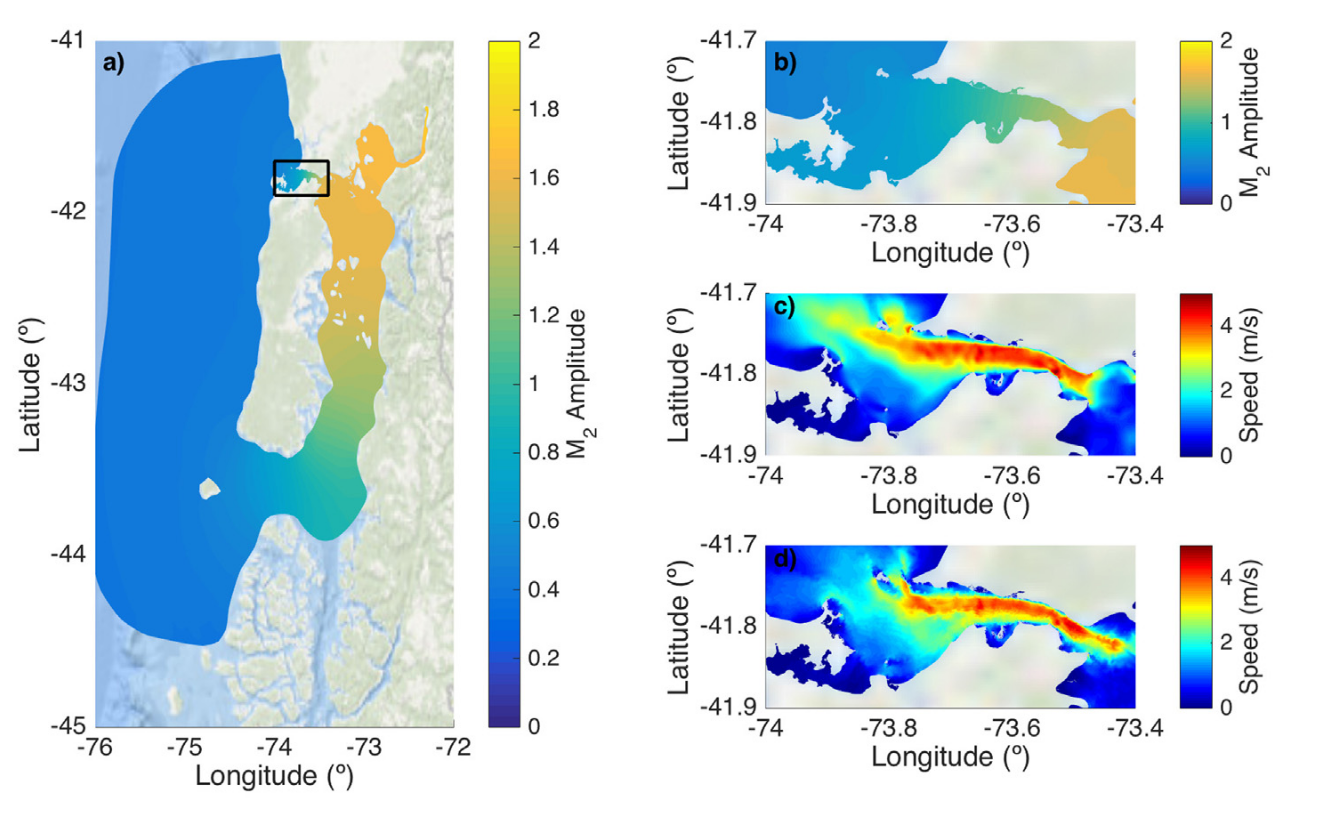
a) M 2 Tidal elevation component along the CIS, black rectangle denotes zoom-in area within Chacao Channel, b) M 2 Tidal elevation component within Chacao Channel, c) maximum ebb depth averaged velocities, and d) maximum flood depth averaged velocities. [2-a]
Flow velocity considerations
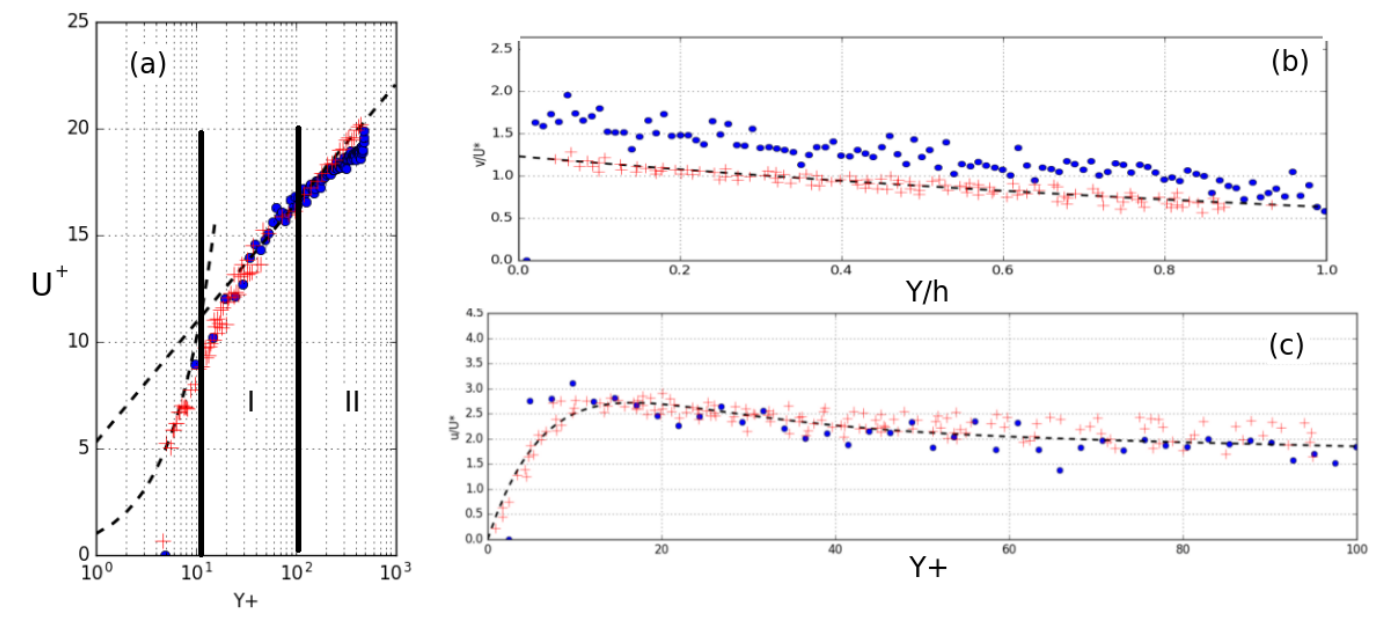
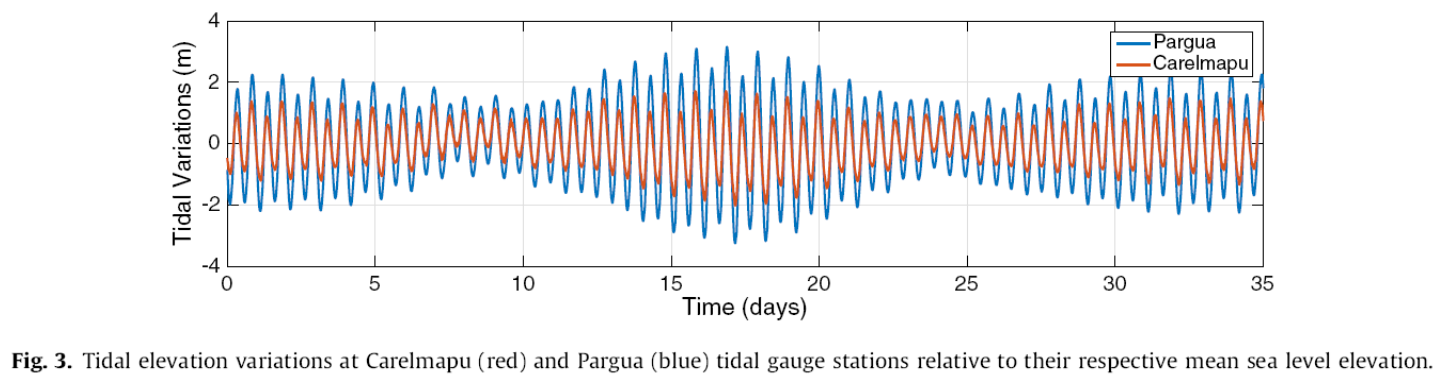
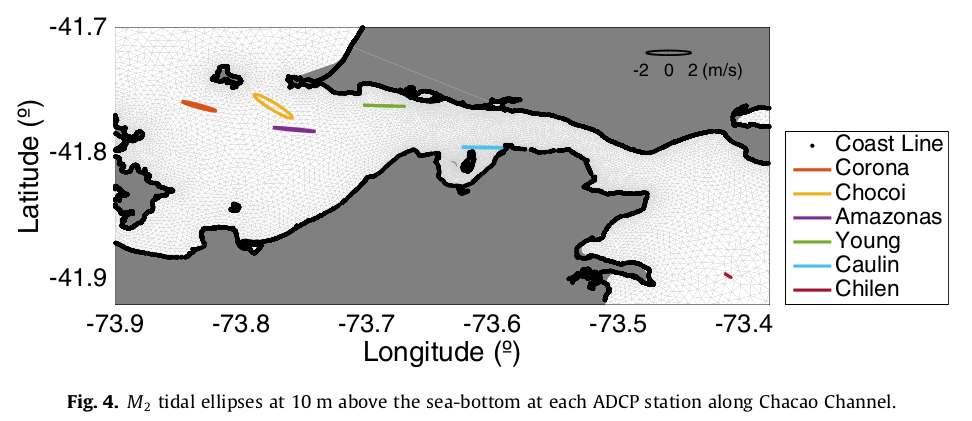
According to Figure 4 of the article “Tidal energy resource characterization in Chacao Channel, Chile” [1-a], the ADCP station located closest to the section of the channel selected for the analysis is Caulin. The velocity profile and averaged magnitude was also extracted from the article (Figure 6) and used to feed the initial and boundary conditions along the simulation. A sine function was used to simulate the variation of the velocity magnitud governed by the tidal variation. The actual tidal variation meaesuredat in the vecinity of the Channel (Carelmapu and Pargua) can be observed in Figure 3 of [2-a] .
Downscaling methodology
Two simulations are performed consecutively following a Downscaling Method.
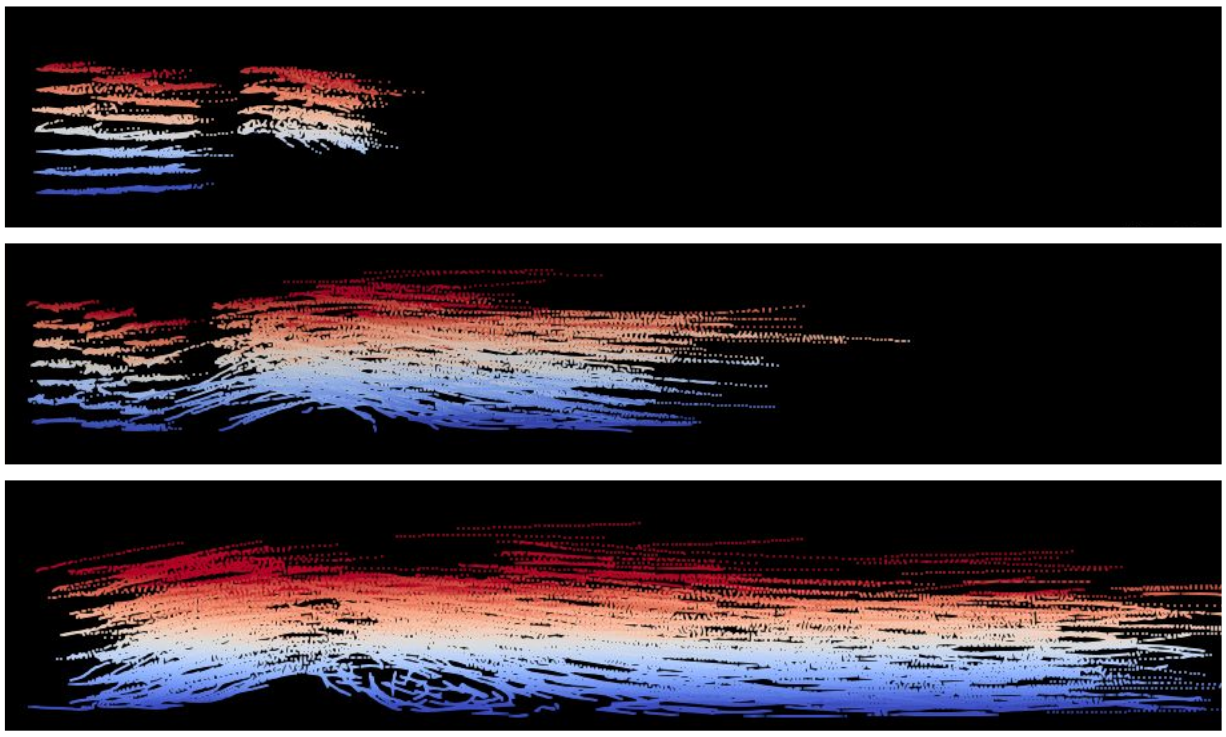
1st- step – Coarse resolution simulation: A first simulations is performed to obtained a the description of the flow in the whole domain at each time step along the variation of the tidal range.
2st- step – Fine resolution simulation: From the results of a first simulation, the initial and boundary conditions are defined for a reduced section of the previous domain. Using finer grids it is posible to describe wake patterns past different MCEC array configurations in higher resolution bathymetries.
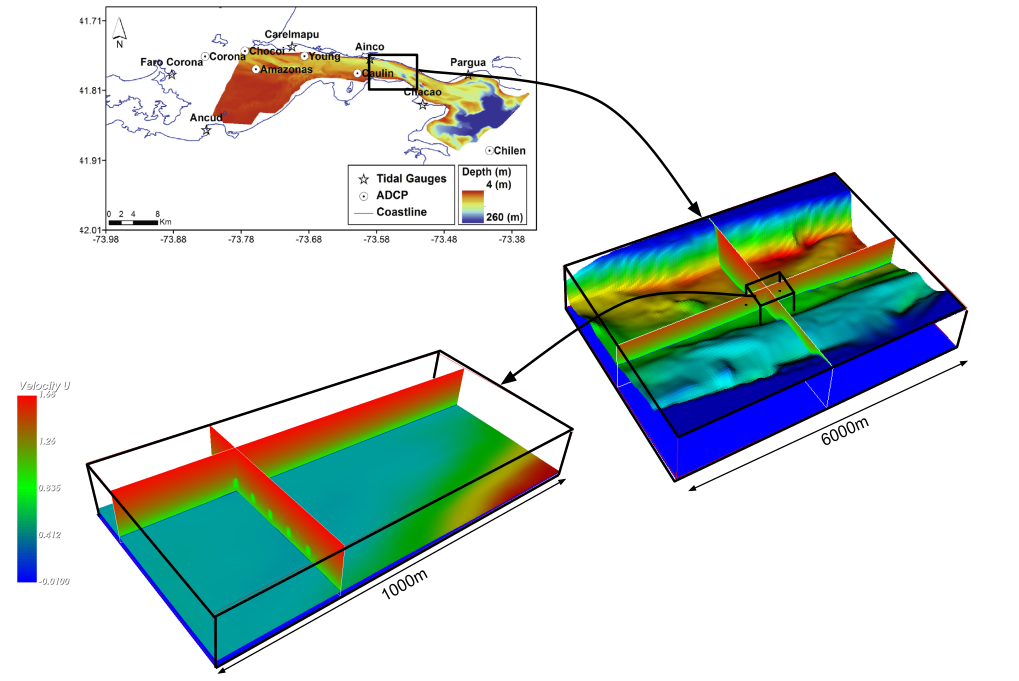
1st – Coarse grid 2nd – Fine grid
Domain size: (6000x4500x100) m Domain size: (700x400x100) m
Grid dimensions: (138x86x100) cells Grid dimensions: (70x40x100) cells
Cell size: (43.5×52.3×1) m Cell size: (10x10x1) m
Particles/cell: 60 Particles/cell: 60
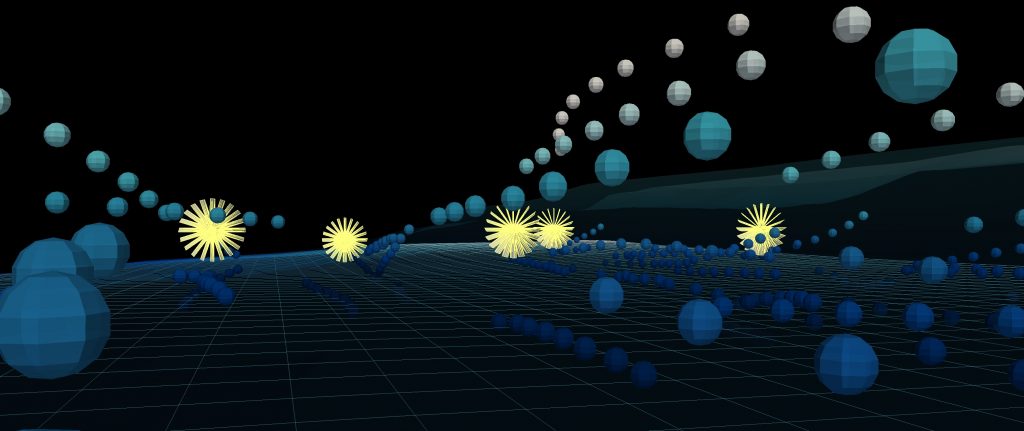
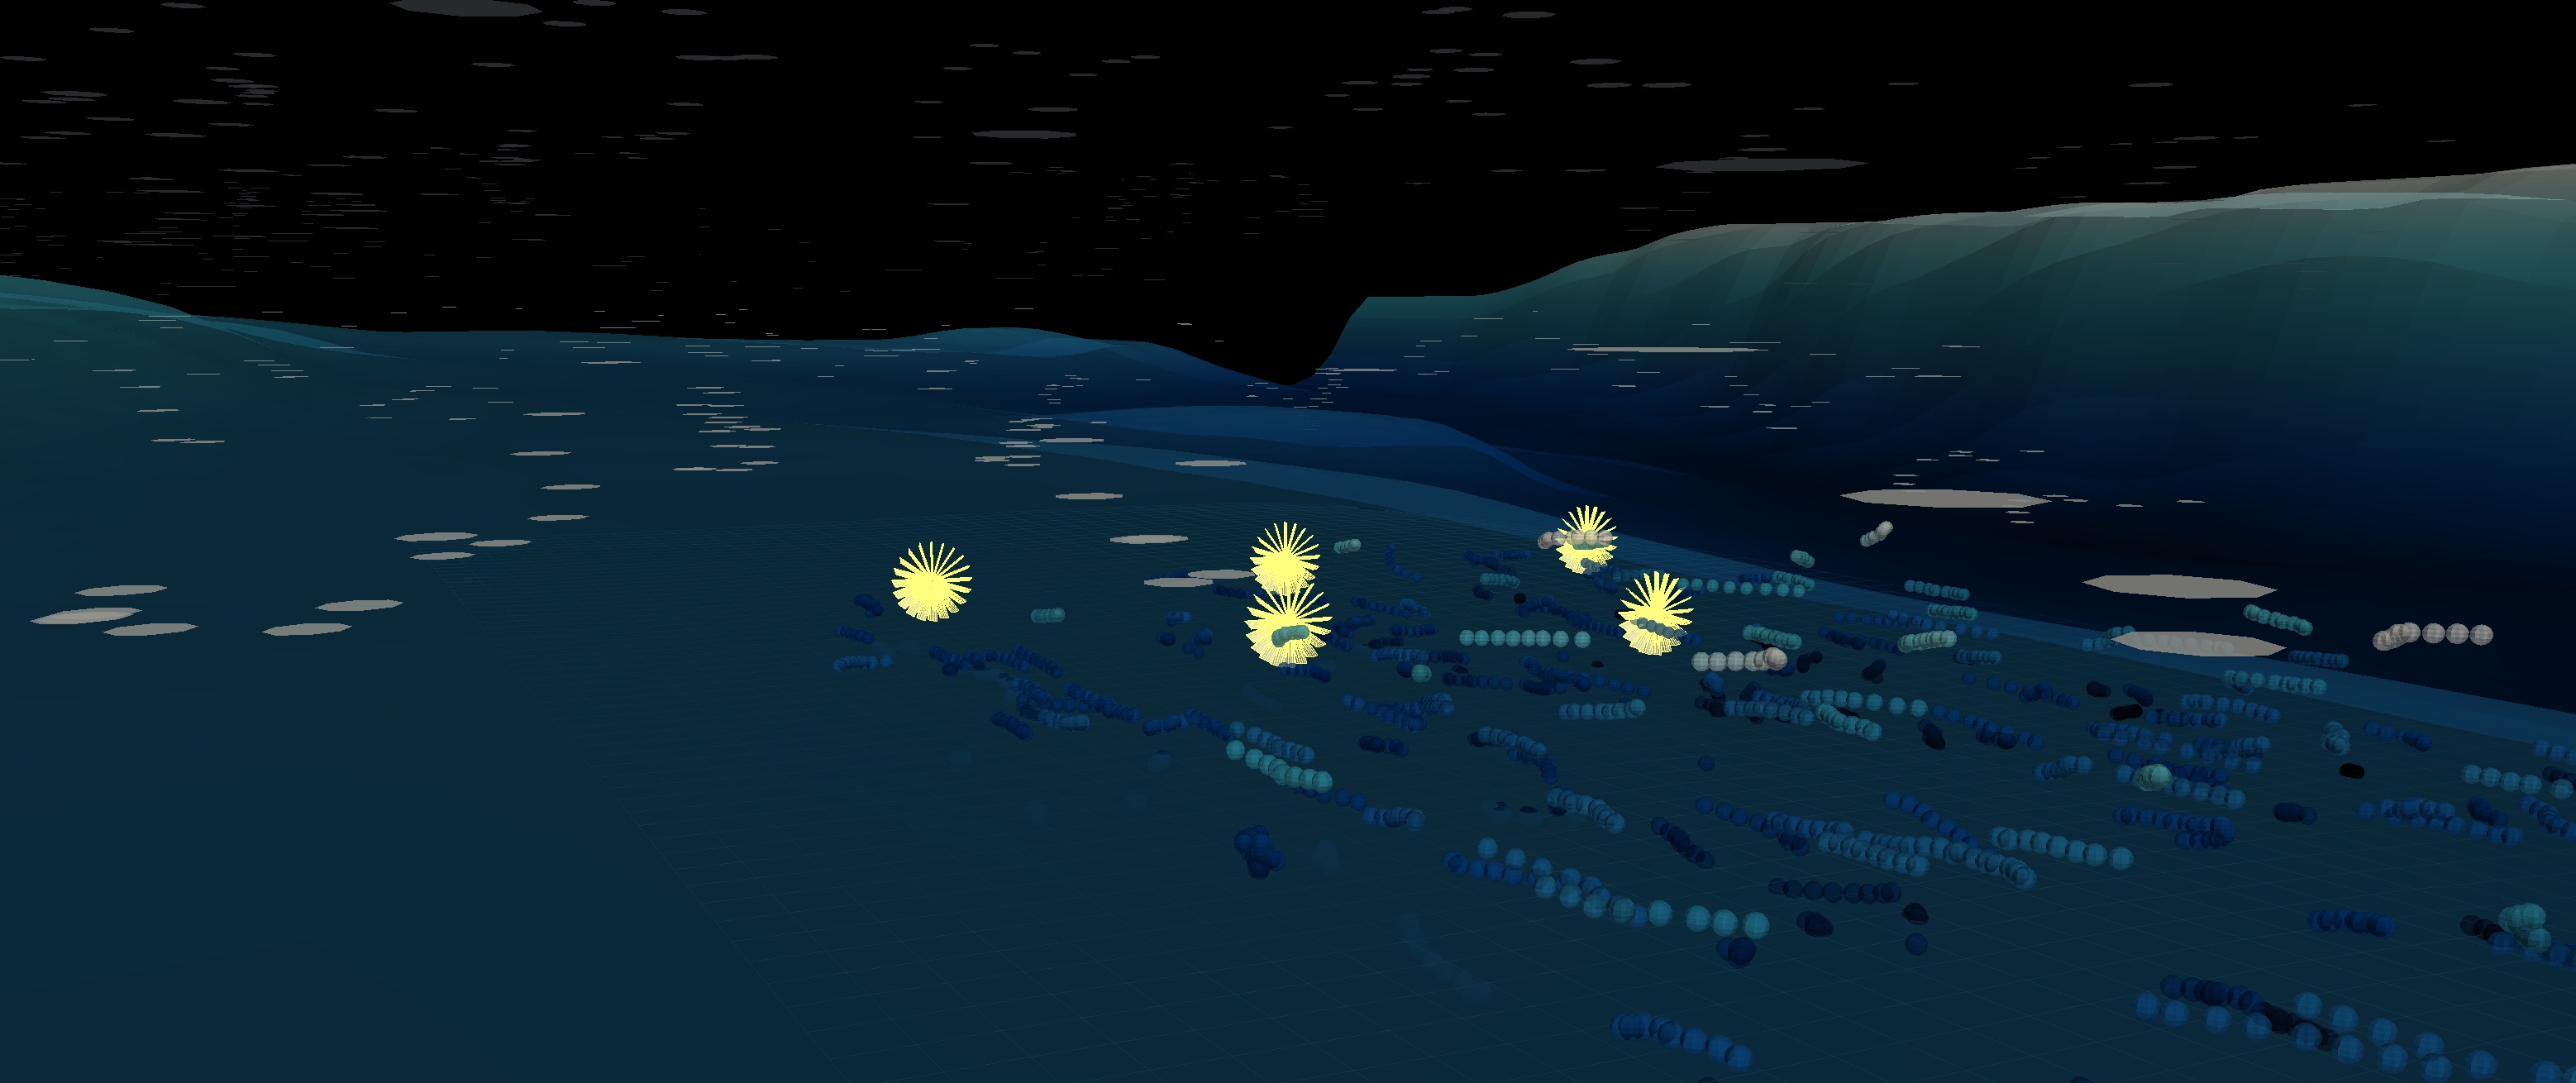
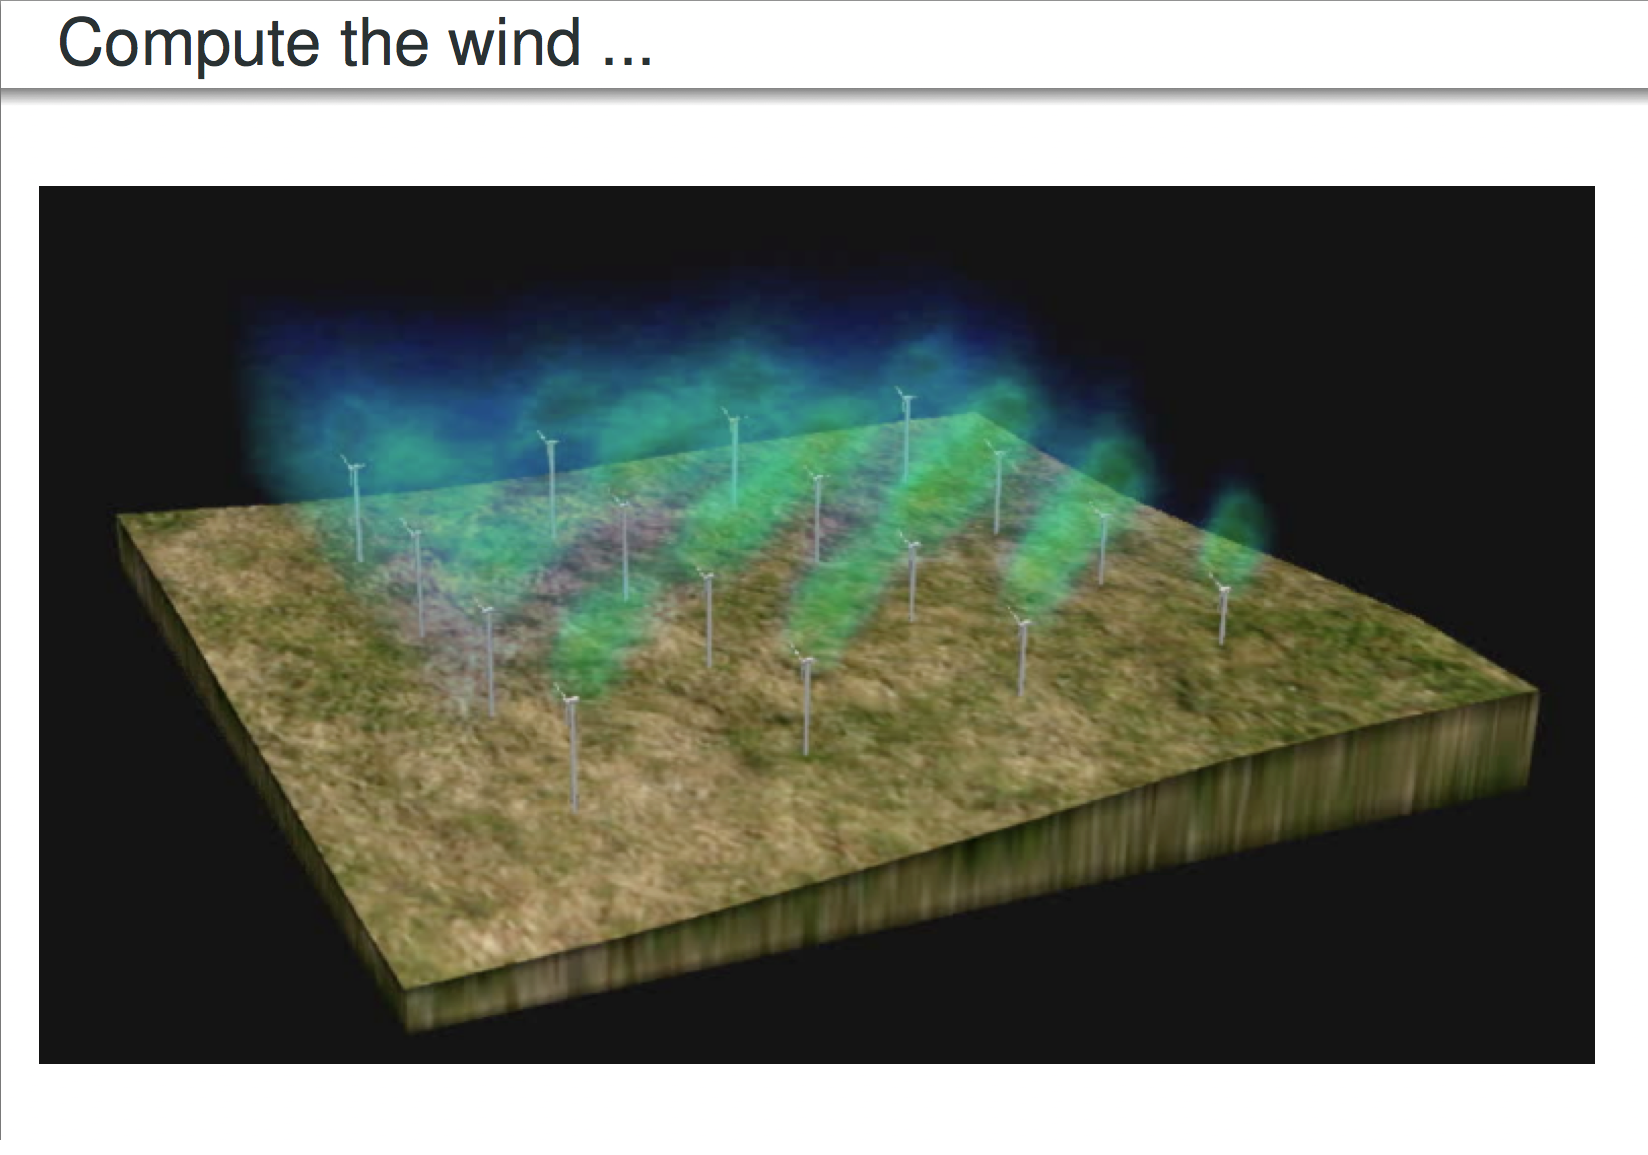
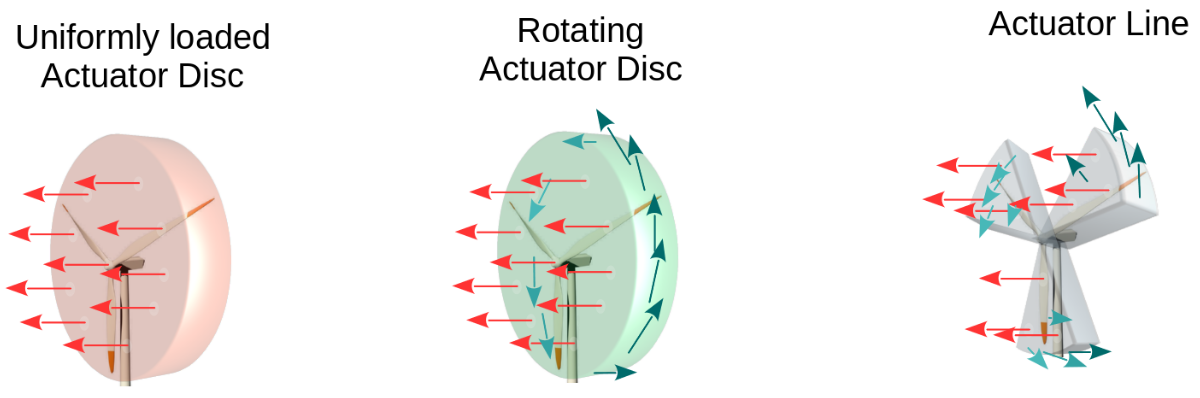
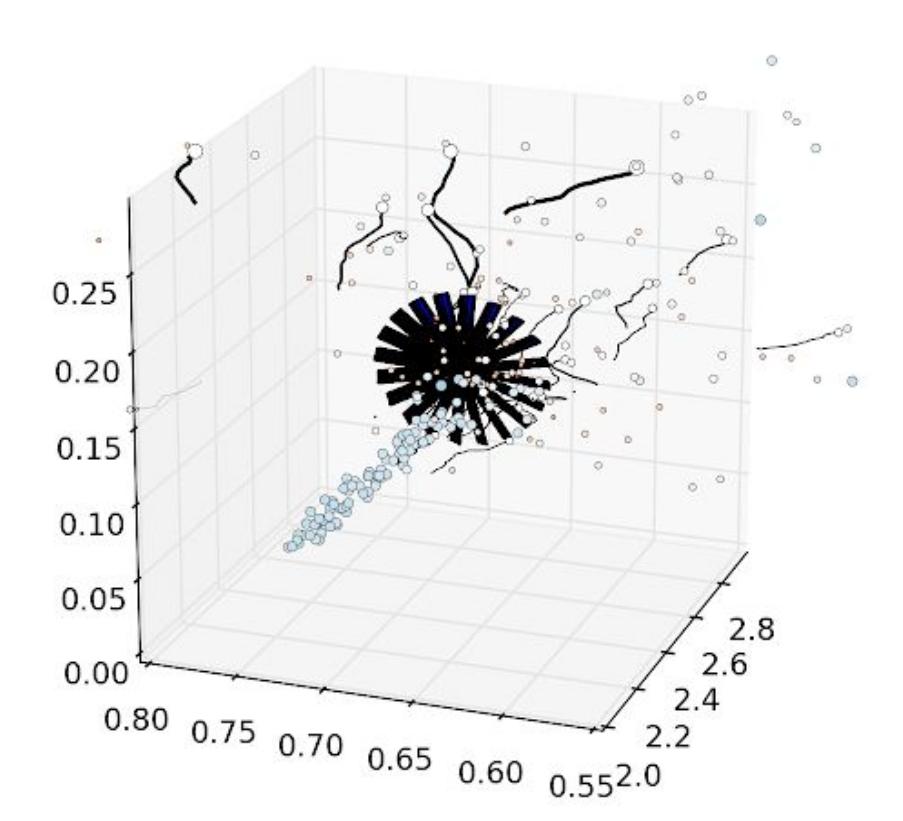
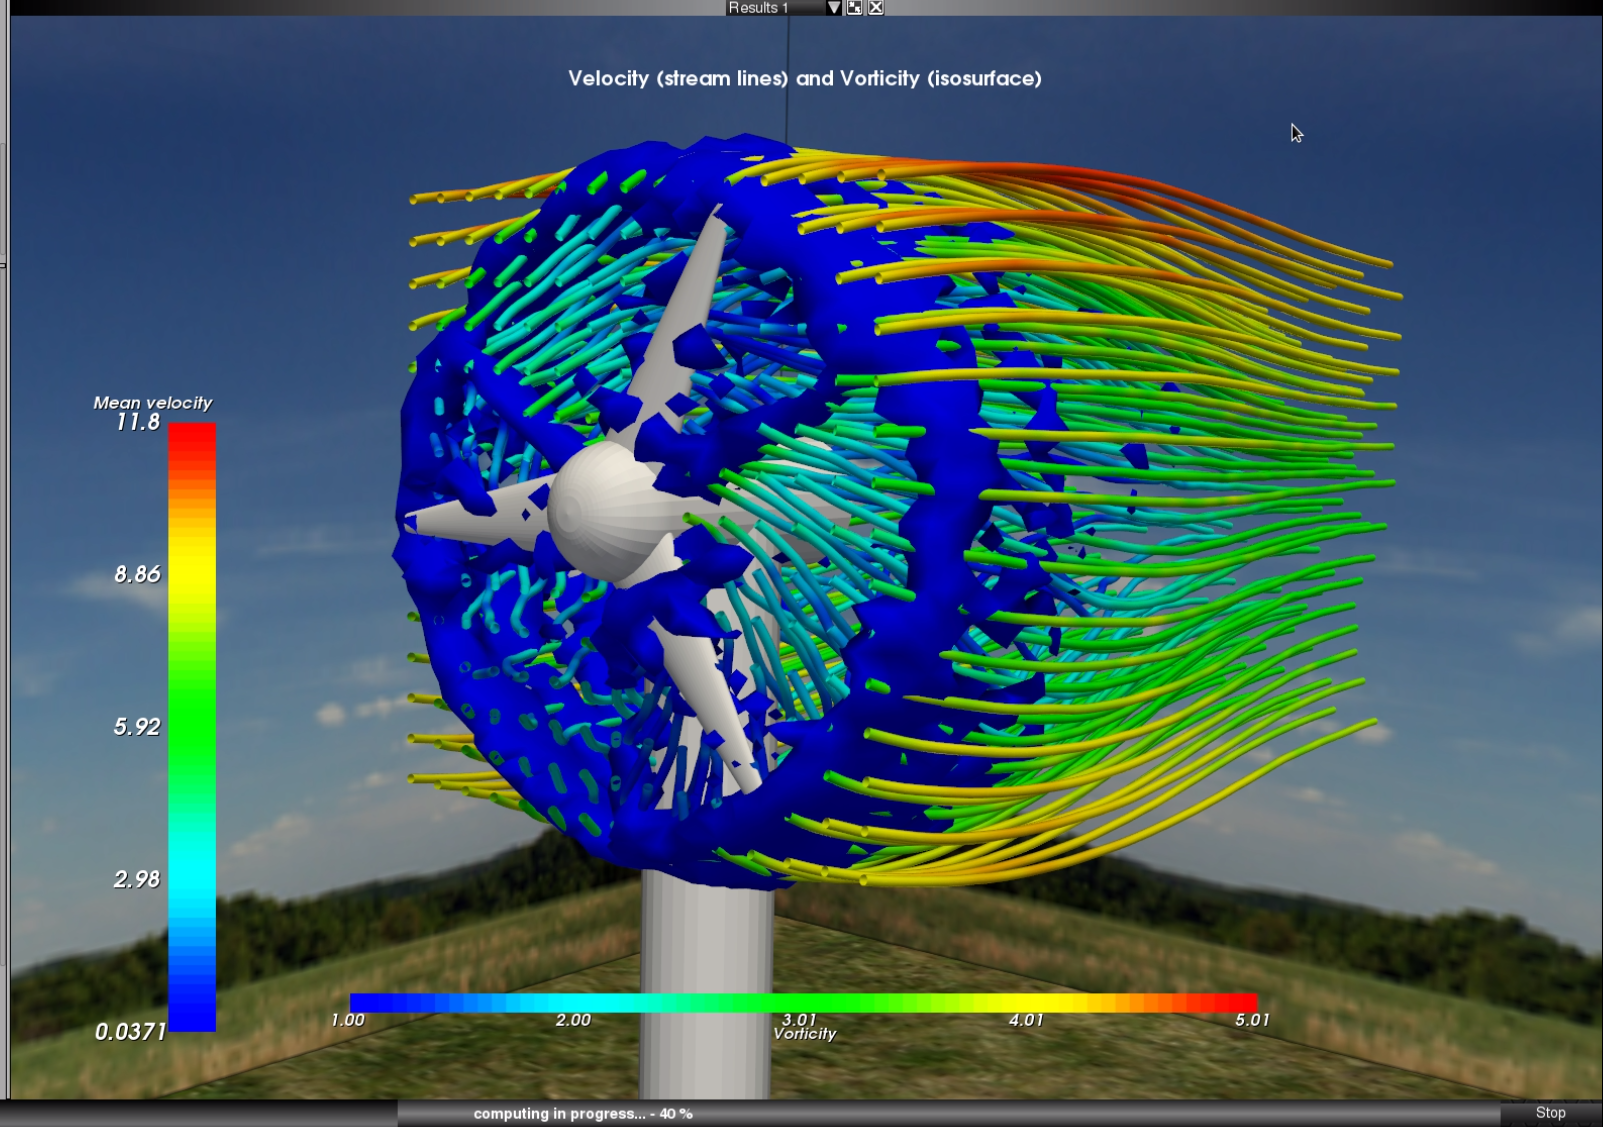
Downscaled simulation phase and actuator disks
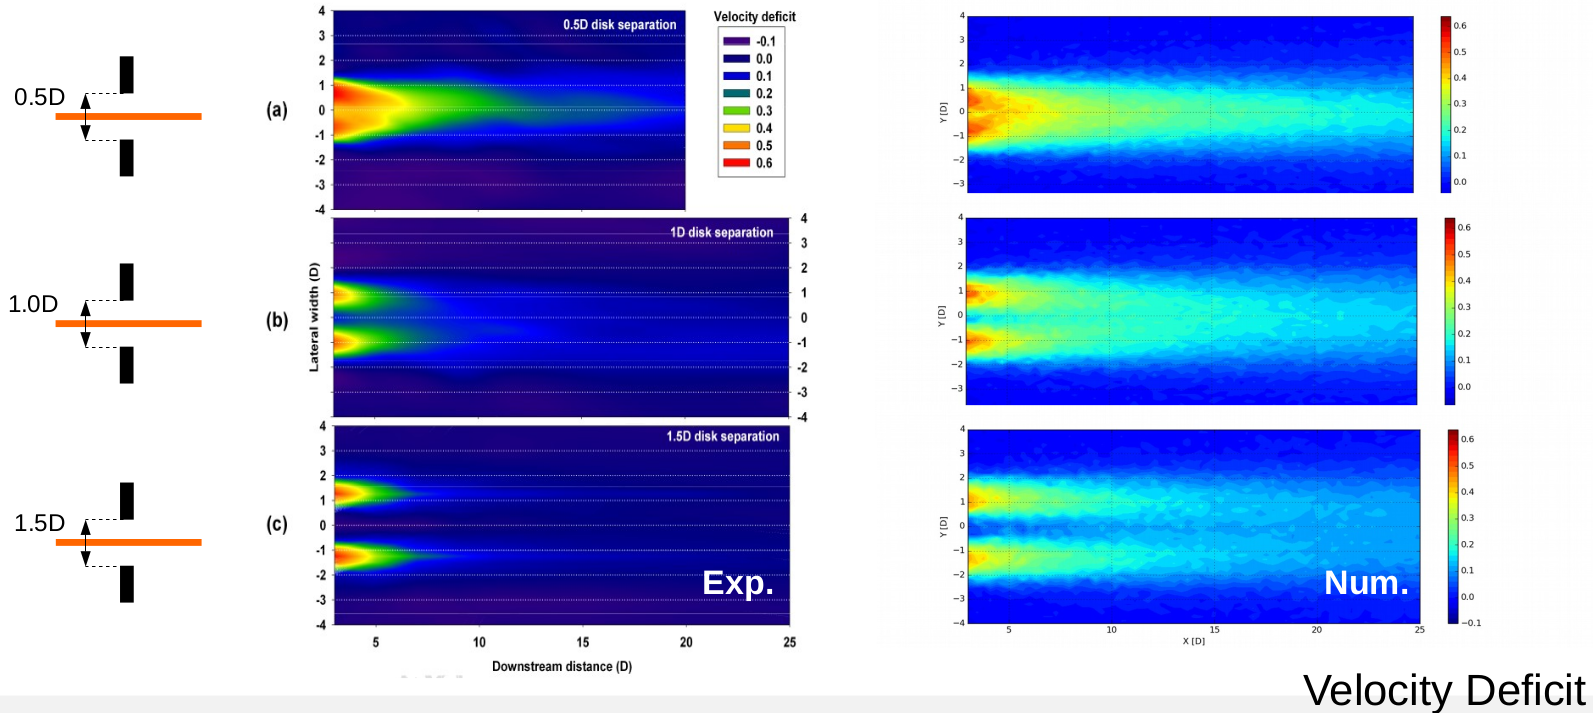
For the downscaled simulation, an arrange of 5 actuator disks were introduced. Sabella’s D10 MCEC turbine dimensions were used to define each of the 5 actuators disk’s diameter (D =10m) and position above the bathymetry (Hdisk =15m). The array selected was formed by a first row of three disks separeted 100m from their centers and a second row located in between the first but 100m behind.


